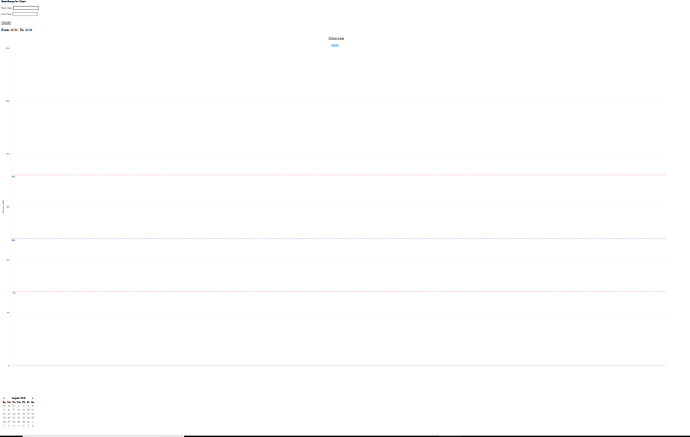
How can get the calendar to pop up to the right of the inputs. Right now it is popping up below the chart. As you can see I tried data-date-orientation but it doesn’t work.
Sorry for all the code and I didn’t include it all either, but wanted to make sure you can see what I am trying to do.
<body>
<h4>Date Range for Chart</h4>
<form method="post" action="<?php echo htmlspecialchars($_SERVER["PHP_SELF"]);?>">
<p>Start Date: <input type="text" name = "start" data-date-orientation="top right" data-provide="datepicker"
data-date-format="yyyy-mm-dd"></p>
<p>End Date: <input type="text" name = "end" data-date-orientation="top right" data-
provide="datepicker" data-date-format="yyyy-mm-dd"></p>
<br>
<input type="submit" name="submit" value="Submit">
</form>
<?php
$conn = mysqli_connect('localhost', 'root', 'root', 'diabetes');
if (mysqli_connect_errno()) {
echo mysqli_connect_errno("Did not connect. :(");
exit();
}
$times = '';
$readings = '';
$start = $_POST["start"];
$end = $_POST['end'];
$sql = "SELECT TIME_FORMAT(readtime,'%H:%i') as rtime, reading, readdate,record_type FROM meter
WHERE readdate >= '".$start."'
AND readdate <= '".$end."'
AND record_type = 1
ORDER BY readdate, readtime; ";
$result = mysqli_query($conn, $sql);
While ($row = mysqli_fetch_array($result, MYSQLI_ASSOC)) {
$time = $row['rtime'];
$reading = $row['reading'];
$times = $times . '"' . $time . '",';
$readings = $readings . $reading . ',';
}
$times = trim($times, ":00,");
$readings = trim($readings, ",");
echo '<hr><h3>From: '.date("m/d",strtotime($start)).' '.' To: '.date("m/d",strtotime($end)).'</h3>';
?>
<div style="width: 75%">
<canvas id="canvas"></canvas>
</div>
<canvas id="myChart" width=75%></canvas>
<script>
var config = {
type: 'line',
data: {
labels: [<?php echo $times; ?>],
datasets: [{
label: '',
backgroundColor: 'rgb(153, 204, 255)', // Changes the color of legend
borderColor: 'rgb(153, 204, 255)', // Changes the line color
pointBackgroundColor: 'rgb(51, 51, 255', // Changes color of dots
data: [<?php echo $readings; ?>],
fill: false,
}]
},
options: {
responsive: true,
title: {
display: true,
fontFamily: 'Arial',
fontSize: 24,
text: 'Glucose'
},
tooltips: {
mode: 'index',
intercept: false
},
scales: {
xAxes: [{
display: true,
ticks: {
callback: function (value) {
return value;
}
}
}],
yAxes: [{
display: true,
ticks: {
max: 300
},
scaleLabel: {
display: true,
labelString: 'Glucose mg/dl'
}
}]
},
annotation: {
annotations: [{
id: 'hline1',
type: 'line',
mode: 'horizontal',
scaleID: 'y-axis-0',
value: 70,
borderColor: 'red',
borderDash: [8, 5],
borderWidth: 1,
label: {
backgroundColor: "white",
fontColor: "green",
content: "70",
enabled: true,
position: "left",
fontStyle: "normal",
xPadding: 0,
xAdjust: 10,
fontSize: 14,
yPadding: 0,
yAdjust: 10
}
}, {
id: 'hline2',
type: 'line',
mode: 'horizontal',
scaleID: 'y-axis-0',
value: 180,
borderColor: 'red',
borderDash: [8, 5],
borderWidth: 1,
label: {
backgroundColor: "white",
fontColor: "green",
fontStyle: "normal",
content: "180",
enabled: true,
position: "left",
xPadding: 0,
fontSize: 14,
yPadding: 0,
yAdjust: 10
}
},
{
id: 'hline3',
type: 'line',
mode: 'horizontal',
scaleID: 'y-axis-0',
value: 120,
borderColor: 'blue',
borderDash: [8, 5],
borderWidth: 1,
label: {
backgroundColor: "white",
fontColor: "blue",
fontStyle: "normal",
content: "120",
enabled: true,
position: "left",
xPadding: 0,
fontSize: 14,
yPadding: 0,
yAdjust: 10
}
}]
}
}
};
window.onload = function () {
var ctx = document.getElementById('canvas').getContext('2d');
window.myLine = new Chart(ctx, config);
};
</script>
</body>
</html>
I include a screenshot. Have to zoom out to get it all on one screen.

